
Use performance graphs to understand a slowdown before restarting or upgrading the server. A short spike and a resource that stays saturated require different responses.
Reviewed: 15 November 2026 against the available panel. Screenshots are real, with identifying information removed. Values illustrate one server at one moment; they are not performance guarantees or plan limits for your service.
Open the correct server
In the customer portal, choose Services → Manage service and check the Service ID, hostname and IP. The Live VPS overview provides quick read-only measurements. For a longer history, acknowledge the management warning and use Open full VPS control panel. In the new tab, choose the same server from List VPS if necessary.
Select a screenshot to open it at full size.
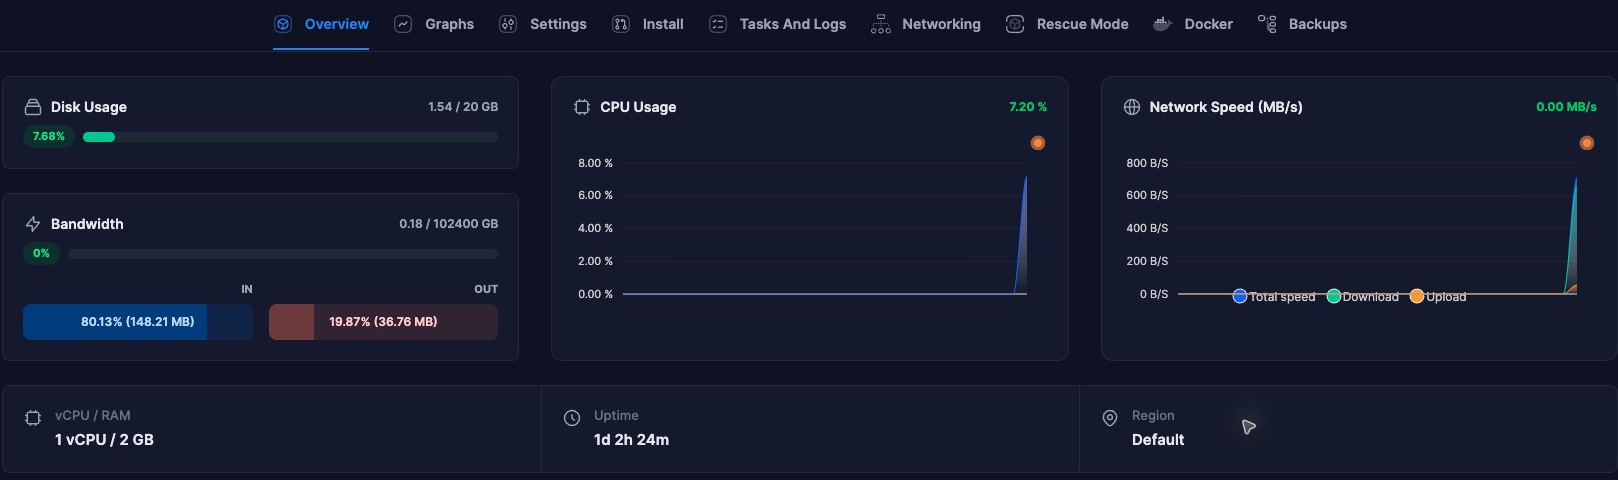
Start with Overview
- Disk Usage measures occupied space, not disk speed. A nearly full filesystem can stop databases, logging and updates even while CPU use is low.
- Bandwidth is accumulated transferred data for the panel's accounting period. IN and OUT separate received and sent data. It is different from instantaneous network speed.
- CPU Usage is a momentary load indicator. Compare sustained activity with the same server's normal pattern rather than interpreting one peak as a fault.
- Network Speed (MB/s) is a transfer rate. Bytes and bits differ: approximately 1 MB/s is 8 Mb/s before protocol overhead. Read the axis units, which may switch to KB/s or B/s for small values.
- vCPU / RAM shows assigned resources. Uptime shows time since boot, not an uptime SLA or the age of your subscription.
Compare a useful time range
Open Graphs. Bandwidth Statistics shows traffic with start/end dates and a monthly chart. System Statistics shows CPU, RAM, inodes, disk space and disk I/O when monitoring is available. Apply a time range covering the incident and note the panel's displayed timezone. A support report using a different timezone can point to the wrong period.
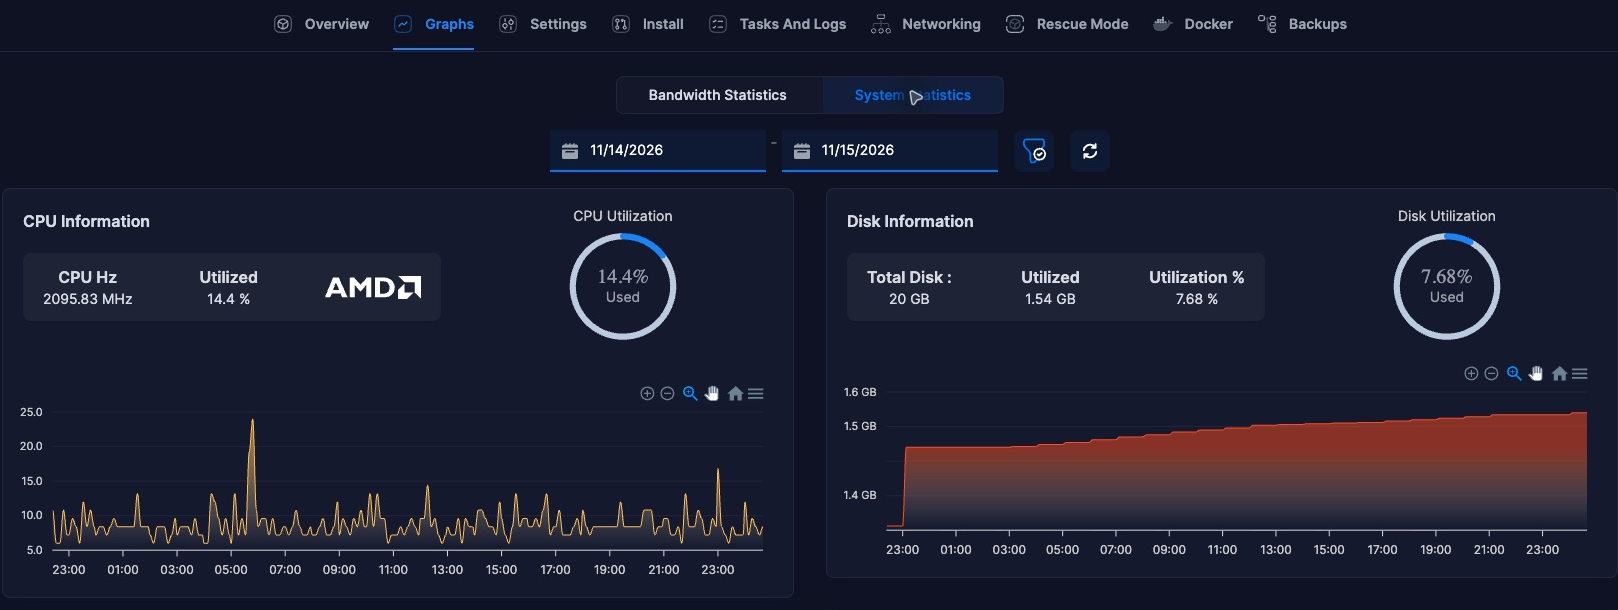
Look for a pattern lasting several samples. Correlate CPU activity with backups, database queries, scheduled jobs or application releases. Disk I/O is read/write throughput; it does not directly measure latency or prove that storage is overloaded. Inodes count filesystem objects: a filesystem with many tiny files can exhaust inodes before all byte capacity is used.
Check inside Linux without changing anything
These read-only commands work on common Linux systems; process names and available utilities vary. Run them through your own SSH session or console:
uptime
free -h
df -h
df -i
ps -eo pid,comm,%cpu,%mem --sort=-%cpu | head -n 12
free distinguishes available memory from cache; used cache alone is not evidence of a memory leak. Compare the guest OS view with panel measurements over the same period. Some metrics are sampled or reported differently by the virtualization layer.
Missing data and next steps
A blank graph, a gap or a failed request is not proof of zero usage. Confirm the server is running, choose another time range, reload once and check Tasks And Logs. Monitoring permissions or guest reporting may limit what is available. Avoid repeated power actions as a response to missing graphs.
If you need help, include the billing Service ID, incident time with timezone, affected application and relevant graph. Remove credentials and unrelated customer data from your screenshot. Explain whether the symptom is slow response, loss of connectivity or a full filesystem. That is more useful than a single CPU number.
Sign out of the separate management panel after use.